Best Super Bowl Ad Ever.

Entry #4,292


The time is now 12:46 pm
You last visited
June 5, 2026, 12:00 pm
All times shown are
Eastern Time (GMT-5:00)

Striped down to the essentials.
| Gross Receipts by Game | 1990 | 1991 | 1992 | 1993 | 1994 | 1995 | 1996 | 1997 | 1998 | 1999 | 2000 | 2001 | 2002 | 2003 | 2004 | 2005 | 2006 | 2007 | 2008 | 2009 | 2010 | 2011 | 2012 | 2013 | 2014 | 2015 | 2016 | 2017 |
| Scratch Ticket Games Sales | $67,800,000* | $248,800,000* | $205,300,000* | $222,000,000* | $204,200,000* | $207,000,000* | $269,200,000* | $272,500,000* | $259,800,000* | $265,500,000* | $282,400,000* | $250,900,000* | $241,000,000* | $210,919,223 | $215,696,083 | $253,425,269 | $267,793,640 | $260,841,696 | $297,972,532 | $324,941,996 | $338,114,154 | $354,813,430 | $355,260,670 | $363,835,268 | $351,912,194 | $376,195,747 | $394,761,644 | $398,311,141 |
| Online Ticket Games Sales Total | $0* | $72,700,000* | $92,300,000* | $106,800,000* | $127,200,000* | $93,000,000* | $106,200,000* | $96,020,000* | $113,100,000* | $124,500,000* | $114,800,000* | $115,300,000* | $136,100,000* | $140,897,381 | $171,222,688 | $154,585,149 | $181,917,023 | $161,770,016 | $163,550,293 | $156,303,137 | $160,854,567 | $149,622,979 | $164,772,867 | $196,562,316 | $179,603,623 | $170,672,222 | $198,091,164 | $165,191,861 |
| Online Ticket Games Sales Itemized | ||||||||||||||||||||||||||||
| Daily 3® | - | - | - | - | - | - | - | - | - | - | - | - | - | $14,123,024 | $13,250,961 | $13,134,177 | $12,958,518 | $13,198,769 | $12,896,317 | $12,417,213 | $12,939,238 | $13,258,715 | $12,844,327 | $13,891,885 | $14,374,236 | $14,633,243 | $16,690,792 | $17,401,351 |
| Gopher 5® | - | - | - | - | - | - | - | - | - | - | - | - | - | $15,828,015 | $18,333,018 | $14,531,607 | $23,751,551 | $13,451,495 | $16,860,714 | $16,485,360 | $15,451,880 | $16,457,217 | $19,611,685 | $20,027,762 | $17,066,341 | $21,815,472 | $15,051,190 | $15,045,596 |
| Powerball® | - | - | - | - | - | - | - | - | - | - | - | - | - | $99,052,849 | $114,291,526 | $89,562,348 | $112,184,974 | $86,770,299 | $91,984,559 | $83,265,951 | $82,252,717 | $59,028,789 | $70,516,182 | $104,153,926 | $77,427,224 | $64,438,029 | $95,690,466 | $62,387,312 |
| Powerball with Power Play® | - | - | - | - | - | - | - | - | - | - | - | - | - | $2,885,867 | $3,233,759 | $2,945,483 | $4,393,871 | $4,822,784 | $5,183,767 | $5,070,512 | $4,997,806 | $3,816,815 | $3,141,464 | $2,969,839 | $2,485,438 | $2,195,749 | $2,800,853 | $2,373,937 |
| Mega Millions® | - | - | - | - | - | - | - | - | - | - | - | - | - | - | - | - | - | - | - | - | $5,900,573 | $17,995,480 | $24,678,710 | $14,019,200 | $25,408,255 | $19,700,950 | $17,186,930 | $15,901,351 |
| Mega Millions with Megaplier® | - | - | - | - | - | - | - | - | - | - | - | - | - | - | - | - | - | - | - | - | $582,425 | $1,545,180 | $1,563,907 | $1,102,376 | $1,536,563 | $1,333,564 | $1,296,041 | $1,234,891 |
| Hot Lotto® | - | - | - | - | - | - | - | - | - | - | - | - | - | $9,007,626 | $10,421,797 | $16,274,511 | $10,823,419 | $18,241,635 | $11,718,951 | $13,565,974 | $13,805,414 | $12,250,143 | $8,604,488 | $11,888,590 | $11,499,441 | $12,813,117 | $8,642,473 | $9,938,710 |
| Hot Lotto® Sizzler® | - | - | - | - | - | - | - | - | - | - | - | - | - | - | - | - | - | - | $480,279 | $1,026,762 | $1,096,382 | $1,065,828 | $823,377 | $1,076,822 | $1,156,486 | $1,342,266 | $928,570 | $1,018,693 |
| Northstar Cash® | - | - | - | - | - | - | - | - | - | - | - | - | - | - | $6,268,682 | $9,373,889 | $9,585,521 | $10,974,105 | $11,381,159 | $11,671,586 | $11,899,536 | $10,872,164 | $9,941,086 | $11,040,160 | $10,040,866 | $9,510,151 | $10,096,816 | $9,249,570 |
| Minnesota Millionaire Raffle | - | - | - | - | - | - | - | - | - | - | - | - | - | - | - | - | - | $4,992,260 | $4,983,459 | $4,989,042 | $4,998,520 | $5,999,710 | $5,993,670 | $5,991,700 | $5,999,680 | $6,999,520 | $6,998,850 | $6,998,580 |
| All or Nothing™ | - | - | - | - | - | - | - | - | - | - | - | - | - | - | - | - | - | - | - | - | - | - | - | - | $3,652,456 | $3,976,389 | $3,238,329 | $4,144,011 |
| MONOPOLY MILLIONAIRES’ CLUB™ | - | - | - | - | - | - | - | - | - | - | - | - | - | - | - | - | - | - | - | - | - | - | - | - | - | $397,375 | - | - |
| Lucky for Life® | - | - | - | - | - | - | - | - | - | - | - | - | - | - | - | - | - | - | - | - | - | - | - | - | - | $5,006,304 | $7,989,328 | $7,743,223 |
| G3® Games / Progressive Print-N-Play® | - | - | - | - | - | - | - | - | - | - | - | - | - | - | $5,422,945 | $8,763,134 | $8,219,169 | $9,318,669 | $8,061,088 | $7,810,737 | $6,930,076 | $7,332,938 | $7,053,971 | $10,400,056 | $8,956,637 | $6,510,093 | $11,480,526 | $12,754,636 |
| Operating Revenue Total Sales | $67,825,593 | $321,487,363 | $297,602,893 | $328,835,922 | $331,475,147 | $335,875,077 | $375,650,142 | $368,516,685 | $372,872,371 | $390,011,807 | $397,286,425 | $366,183,765 | $377,132,055 | $351,816,604 | $386,918,771 | $408,010,418 | $449,710,663 | $422,611,712 | $461,522,825 | $481,245,133 | $498,968,721 | $504,436,409 | $520,033,537 | $560,397,584 | $531,515,817 | $546,867,969 | $592,852,808 | $563,503,002 |
| Less In-Lieu-of-Sales Tax | $4,069,578 | $19,289,242 | $19,344,186 | $21,374,335 | $21,545,886 | $21,831,883 | $24,417,263 | $23,953,615 | $24,236,714 | $25,350,752 | $25,823,618 | $23,801,945 | $24,513,584 | $22,868,079 | $25,149,720 | $26,520,677 | $29,231,193 | $27,469,761 | $29,998,984 | $31,280,934 | $32,432,967 | $32,788,367 | $33,802,180 | $36,425,843 | $34,548,528 | $35,546,418 | $38,535,433 | $36,627,696 |
| Gross Receipts | $63,756,015 | $302,198,121 | $278,258,707 | $307,461,587 | $309,929,261 | $314,043,194 | $351,232,879 | $344,563,070 | $348,635,657 | $364,661,055 | $371,462,807 | $342,381,820 | $352,618,471 | $328,948,525 | $361,769,051 | $381,489,741 | $420,479,470 | $395,141,951 | $431,523,841 | $449,964,199 | $466,535,754 | $471,648,042 | $486,231,357 | $523,971,741 | $496,967,289 | $511,321,551 | $554,317,375 | $526,875,306 |
*Approximation estimates based on MN Annual Reports.


...Soup, Salad and a Samich.
Then Sitting down with Our President during the State of the Union.
We're going to enjoy every bit of it.
![]()
LOWEST RATED IN HISTORY https://t.co/NCn4lz8Z28
— DRUDGE REPORT (@DRUDGE_REPORT) January 29, 2018
https://www.hollywoodreporter.com/live-feed/2018-grammy-ratings-sink-years-1079604
Haven't watched in decades.
![]()
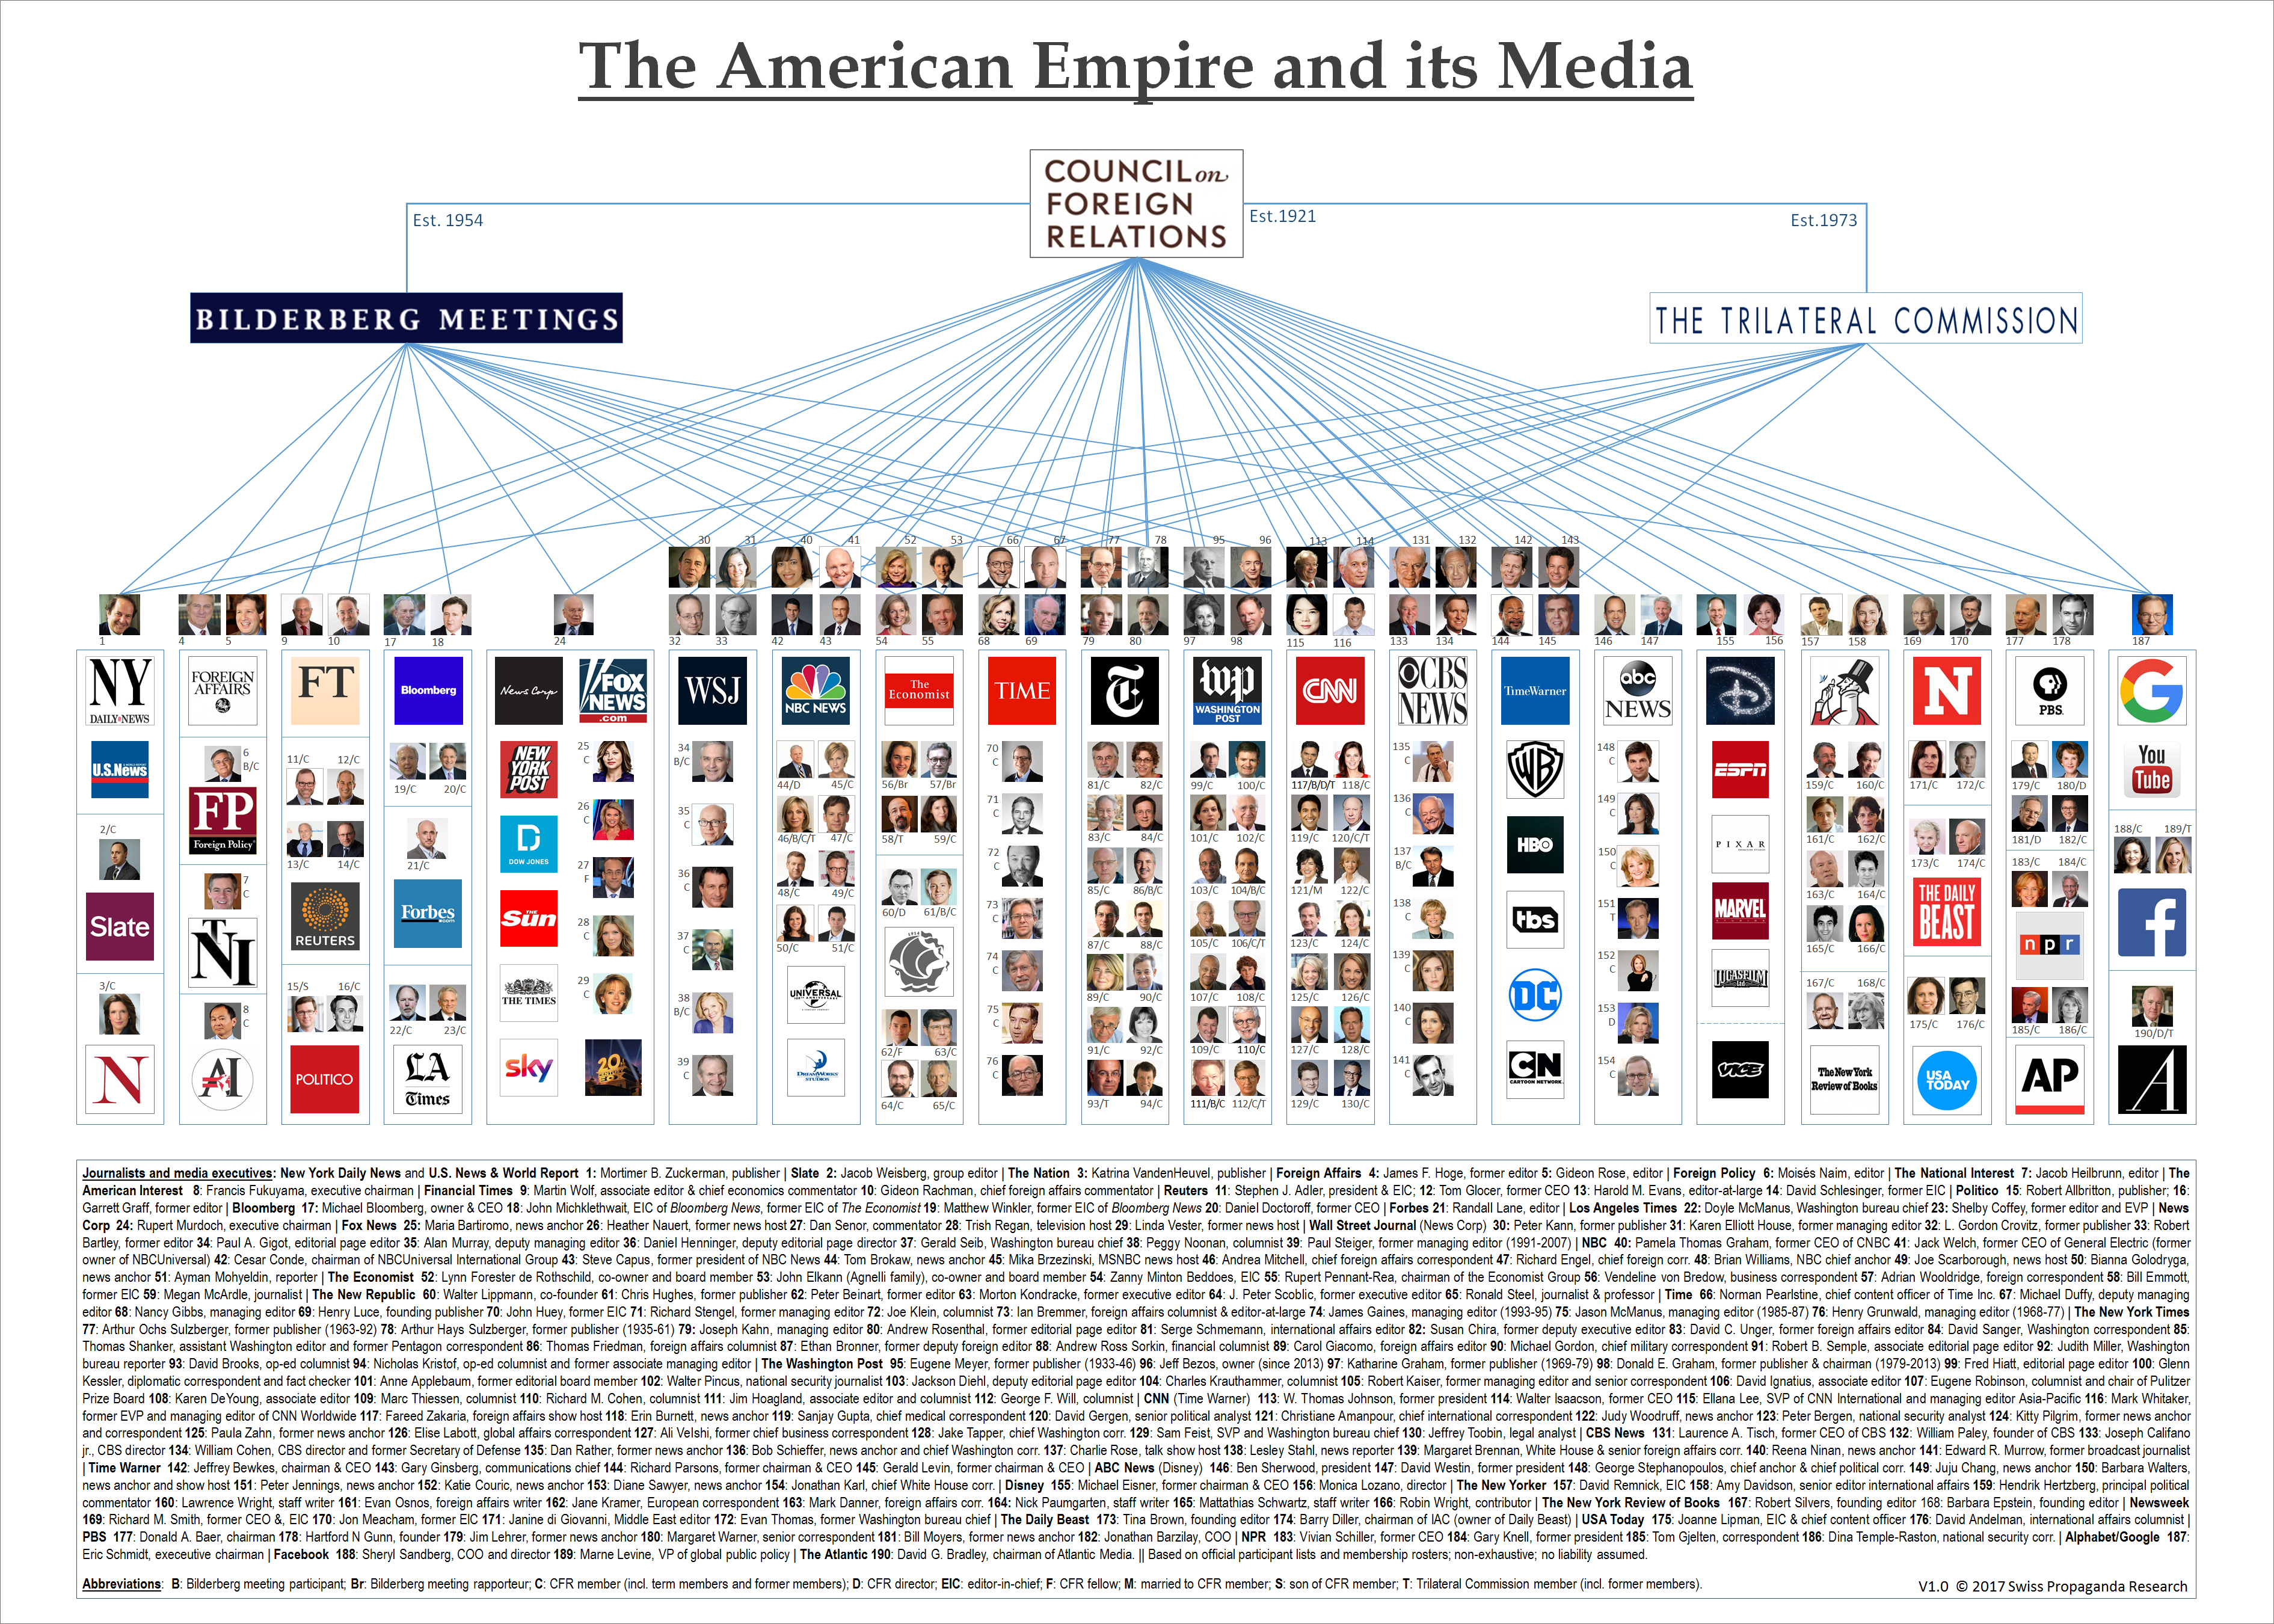
Council on Foreign Relations links to major media holdings
— Julian Assange ? (@JulianAssange) January 28, 2018
Full graphic here: https://t.co/lyMPz4ME2Z pic.twitter.com/mmTNdQa1F9
click on for larger image
We'll be watching...
![]()
That's a frozen turd stuck to his ass.

We Developed an Interesting Power Measurement.
Friday, November 3, 2017
Comments:
| Year | ||||||||||||||||||||||
| Gross Receipts by Game | 1995 | 1996 | 1997 | 1998 | 1999 | 2000 | 2001 | 2002 | 2003 | 2004 | 2005 | 2006 | 2007 | 2008 | 2009 | 2010 | 2011 | 2012 | 2013 | 2014 | 2015 | 2016 |
| Scratch Ticket Games Sales | - | - | $272,500,000* | $259,800,000* | $265,500,000* | $282,400,000* | $250,900,000* | $241,000,000* | $210,919,223 | $215,696,083 | $253,425,269 | $267,793,640 | $260,841,696 | $297,972,532 | $324,941,996 | $338,114,154 | $354,813,430 | $355,260,670 | $363,835,268 | $351,912,194 | $376,195,747 | $394,761,644 |
| Online Ticket Games Sales Total | - | - | $96,020,000* | $113,100,000* | $124,500,000* | $114,800,000* | $115,300,000* | $136,100,000* | $140,897,381 | $171,222,688 | $154,585,149 | $181,917,023 | $161,770,016 | $163,550,293 | $156,303,137 | $160,854,567 | $149,622,979 | $164,772,867 | $196,562,316 | $179,603,623 | $170,672,222 | $198,091,164 |
| Online Ticket Games Sales Itemized | ||||||||||||||||||||||
| Daily 3® | - | - | - | - | - | - | - | - | $14,123,024 | $13,250,961 | $13,134,177 | $12,958,518 | $13,198,769 | $12,896,317 | $12,417,213 | $12,939,238 | $13,258,715 | $12,844,327 | $13,891,885 | $14,374,236 | $14,633,243 | $16,690,792 |
| Gopher 5® | - | - | - | - | - | - | - | - | $15,828,015 | $18,333,018 | $14,531,607 | $23,751,551 | $13,451,495 | $16,860,714 | $16,485,360 | $15,451,880 | $16,457,217 | $19,611,685 | $20,027,762 | $17,066,341 | $21,815,472 | $15,051,190 |
| Powerball® | - | - | - | - | - | - | - | - | $99,052,849 | $114,291,526 | $89,562,348 | $112,184,974 | $86,770,299 | $91,984,559 | $83,265,951 | $82,252,717 | $59,028,789 | $70,516,182 | $104,153,926 | $77,427,224 | $64,438,029 | $95,690,466 |
| Powerball with Power Play® | - | - | - | - | - | - | - | - | $2,885,867 | $3,233,759 | $2,945,483 | $4,393,871 | $4,822,784 | $5,183,767 | $5,070,512 | $4,997,806 | $3,816,815 | $3,141,464 | $2,969,839 | $2,485,438 | $2,195,749 | $2,800,853 |
| Mega Millions® | - | - | - | - | - | - | - | - | - | - | - | - | - | - | - | $5,900,573 | $17,995,480 | $24,678,710 | $14,019,200 | $25,408,255 | $19,700,950 | $17,186,930 |
| Mega Millions with Megaplier® | - | - | - | - | - | - | - | - | - | - | - | - | - | - | - | $582,425 | $1,545,180 | $1,563,907 | $1,102,376 | $1,536,563 | $1,333,564 | $1,296,041 |
| Hot Lotto® | - | - | - | - | - | - | - | - | $9,007,626 | $10,421,797 | $16,274,511 | $10,823,419 | $18,241,635 | $11,718,951 | $13,565,974 | $13,805,414 | $12,250,143 | $8,604,488 | $11,888,590 | $11,499,441 | $12,813,117 | $8,642,473 |
| Hot Lotto® Sizzler® | - | - | - | - | - | - | - | - | - | - | - | - | - | $480,279 | $1,026,762 | $1,096,382 | $1,065,828 | $823,377 | $1,076,822 | $1,156,486 | $1,342,266 | $928,570 |
| Northstar Cash® | - | - | - | - | - | - | - | - | - | $6,268,682 | $9,373,889 | $9,585,521 | $10,974,105 | $11,381,159 | $11,671,586 | $11,899,536 | $10,872,164 | $9,941,086 | $11,040,160 | $10,040,866 | $9,510,151 | $10,096,816 |
| Minnesota Millionaire Raffle | - | - | - | - | - | - | - | - | - | - | - | - | $4,992,260 | $4,983,459 | $4,989,042 | $4,998,520 | $5,999,710 | $5,993,670 | $5,991,700 | $5,999,680 | $6,999,520 | $6,998,850 |
| All or Nothing™ | - | - | - | - | - | - | - | - | - | - | - | - | - | - | - | - | - | - | - | $3,652,456 | $3,976,389 | $3,238,329 |
| MONOPOLY MILLIONAIRES’ CLUB™ | - | - | - | - | - | - | - | - | - | - | - | - | - | - | - | - | - | - | - | - | $397,375 | - |
| Lucky for Life® | - | - | - | - | - | - | - | - | - | - | - | - | - | - | - | - | - | - | - | - | $5,006,304 | $7,989,328 |
| G3® Games / Progressive Print-N-Play® | - | - | - | - | - | - | - | - | - | $5,422,945 | $8,763,134 | $8,219,169 | $9,318,669 | $8,061,088 | $7,810,737 | $6,930,076 | $7,332,938 | $7,053,971 | $10,400,056 | $8,956,637 | $6,510,093 | $11,480,526 |
| Operating Revenue Total Sales | $335,875,077 | $375,650,142 | $368,516,685 | $372,872,371 | $390,011,807 | $397,286,425 | $366,183,765 | $377,132,055 | $351,816,604 | $386,918,771 | $408,010,418 | $449,710,663 | $422,611,712 | $461,522,825 | $481,245,133 | $498,968,721 | $504,436,409 | $520,033,537 | $560,397,584 | $531,515,817 | $546,867,969 | $592,852,808 |
| Other Income | - | - | - | - | - | - | - | - | - | $17,049 | $2,743 | $49,982 | $14,152 | $57,979 | $95,297 | $39,772 | $88,136 | $53,453 | $92,321 | $42,729 | $26,970 | $14,783 |
| Total Operating Revenue | $335,875,077 | $375,650,142 | $368,516,685 | $372,872,371 | $390,011,807 | $397,286,425 | $366,183,765 | $377,132,055 | $351,816,604 | $386,935,820 | $408,013,161 | $449,760,645 | $422,625,865 | $461,580,804 | $481,340,430 | $499,008,493 | $504,524,545 | $520,086,990 | $560,489,905 | $531,558,546 | $546,894,939 | $592,867,591 |
| Less In-Lieu-of-Sales Tax | $21,831,883 | $24,417,263 | $23,953,615 | $24,236,714 | $25,350,752 | $25,823,618 | $23,801,945 | $24,513,584 | $22,868,079 | $25,149,720 | $26,520,677 | $29,231,193 | $27,469,761 | $29,998,984 | $31,280,934 | $32,432,967 | $32,788,367 | $33,802,180 | $36,425,843 | $34,548,528 | $35,546,418 | $38,535,433 |
| Gross Receipts | $328,948,525 | $328,948,525 | $328,948,525 | $328,948,525 | $328,948,525 | $328,948,525 | $328,948,525 | $328,948,525 | $328,948,525 | $361,786,100 | $381,492,484 | $420,529,452 | $395,156,103 | $431,581,820 | $450,059,496 | $466,575,526 | $471,736,178 | $486,284,810 | $524,064,062 | $497,010,018 | $511,348,521 | $554,332,158 |
* approximate values
We've calculated the Sales Tax for years 1995 to 2015 at 6.500%.
But, in 2009 the sales tax changed to 6.875%.
Something seems askew.
| Year | Sales | Sales Tax | Calculated Tax % |
| 1994 | - | - | - |
| 1995 | $335,875,077 | $21,831,883 | 6.500% |
| 1996 | $375,650,142 | $24,417,263 | 6.500% |
| 1997 | $368,516,685 | $23,953,615 | 6.500% |
| 1998 | $372,872,371 | $24,236,714 | 6.500% |
| 1999 | $390,011,807 | $25,350,752 | 6.500% |
| 2000 | $397,286,425 | $25,823,618 | 6.500% |
| 2001 | $366,183,765 | $23,801,945 | 6.500% |
| 2002 | $377,132,055 | $24,513,584 | 6.500% |
| 2003 | $351,816,604 | $22,868,079 | 6.500% |
| 2004 | $386,918,771 | $25,149,720 | 6.500% |
| 2005 | $408,010,418 | $26,520,677 | 6.500% |
| 2006 | $449,710,663 | $29,231,193 | 6.500% |
| 2007 | $422,611,712 | $27,469,761 | 6.500% |
| 2008 | $461,522,825 | $29,998,984 | 6.500% |
| 2009 | $481,245,133 | $31,280,934 | 6.500% |
| 2010 | $498,968,721 | $32,432,967 | 6.500% |
| 2011 | $504,436,409 | $32,788,367 | 6.500% |
| 2012 | $520,033,537 | $33,802,180 | 6.500% |
| 2013 | $560,397,584 | $36,425,843 | 6.500% |
| 2014 | $531,515,817 | $34,548,528 | 6.500% |
| 2015 | $546,867,969 | $35,546,418 | 6.500% |
| 2016 | $592,900,000 | ? | ? |
| 2017 | - | - | - |
If the 6.875% is applicable to the lottery back in 2009, then the state is out about $13,600,000 from 2009 to 2015; possibly more if 2016 and 2017 are figured in... just a note, but maybe an audit is needed?
| Gross Receipts by Game | 2004 | 2005 | 2006 | 2007 | 2008 | 2009 | 2010 | 2011 | 2012 | 2013 | 2014 | 2015 | 2016 |
| Scratch Ticket Games Sales | $215,696,083 | $253,425,269 | $267,793,640 | $260,841,696 | $297,972,532 | $324,941,996 | $338,114,154 | $354,813,430 | $355,260,670 | $363,835,268 | $351,912,194 | $376,195,747 | $394,800,000 |
| Online Ticket Games Sales Total | $171,222,688 | $154,585,149 | $181,917,023 | $161,770,016 | $163,550,293 | $156,303,137 | $160,854,567 | $149,622,979 | $164,772,867 | $196,562,316 | $179,603,623 | $170,672,222 | $198,100,000 |
| Online Ticket Games Sales Itemized | |||||||||||||
| Daily 3® | $13,250,961 | $13,134,177 | $12,958,518 | $13,198,769 | $12,896,317 | $12,417,213 | $12,939,238 | $13,258,715 | $12,844,327 | $13,891,885 | $14,374,236 | $14,633,243 | - |
| Gopher 5® | $18,333,018 | $14,531,607 | $23,751,551 | $13,451,495 | $16,860,714 | $16,485,360 | $15,451,880 | $16,457,217 | $19,611,685 | $20,027,762 | $17,066,341 | $21,815,472 | - |
| Powerball® | $114,291,526 | $89,562,348 | $112,184,974 | $86,770,299 | $91,984,559 | $83,265,951 | $82,252,717 | $59,028,789 | $70,516,182 | $104,153,926 | $77,427,224 | $64,438,029 | - |
| Powerball with Power Play® | $3,233,759 | $2,945,483 | $4,393,871 | $4,822,784 | $5,183,767 | $5,070,512 | $4,997,806 | $3,816,815 | $3,141,464 | $2,969,839 | $2,485,438 | $2,195,749 | - |
| Mega Millions® | - | - | - | - | - | - | $5,900,573 | $17,995,480 | $24,678,710 | $14,019,200 | $25,408,255 | $19,700,950 | - |
| Mega Millions with Megaplier® | - | - | - | - | - | - | $582,425 | $1,545,180 | $1,563,907 | $1,102,376 | $1,536,563 | $1,333,564 | - |
| Hot Lotto® | $10,421,797 | $16,274,511 | $10,823,419 | $18,241,635 | $11,718,951 | $13,565,974 | $13,805,414 | $12,250,143 | $8,604,488 | $11,888,590 | $11,499,441 | $12,813,117 | - |
| Hot Lotto® Sizzler® | - | - | - | - | $480,279 | $1,026,762 | $1,096,382 | $1,065,828 | $823,377 | $1,076,822 | $1,156,486 | $1,342,266 | - |
| Northstar Cash® | $6,268,682 | $9,373,889 | $9,585,521 | $10,974,105 | $11,381,159 | $11,671,586 | $11,899,536 | $10,872,164 | $9,941,086 | $11,040,160 | $10,040,866 | $9,510,151 | - |
| Minnesota Millionaire Raffle | - | - | - | $4,992,260 | $4,983,459 | $4,989,042 | $4,998,520 | $5,999,710 | $5,993,670 | $5,991,700 | $5,999,680 | $6,999,520 | - |
| All or Nothing™ | - | - | - | - | - | - | - | - | - | - | $3,652,456 | $3,976,389 | - |
| MONOPOLY MILLIONAIRES’ CLUB™ | - | - | - | - | - | - | - | - | - | - | - | $397,375 | - |
| Lucky for Life® | - | - | - | - | - | - | - | - | - | - | - | $5,006,304 | - |
| G3® Games / Progressive Print-N-Play® | $5,422,945 | $8,763,134 | $8,219,169 | $9,318,669 | $8,061,088 | $7,810,737 | $6,930,076 | $7,332,938 | $7,053,971 | $10,400,056 | $8,956,637 | $6,510,093 | - |
| Operating Revenue Total Sales | $386,918,771 | $408,010,418 | $449,710,663 | $422,611,712 | $461,522,825 | $481,245,133 | $498,968,721 | $504,436,409 | $520,033,537 | $560,397,584 | $531,515,817 | $546,867,969 | $592,900,000 |